If you follow these updates, you might remember July’s numbers looked a little soft, especially in Southern York County. August puts that in perspective.
York County's median sold price came in at $322,550 in August 2026, back in line with June after a softer July, while homes continued to sell in around 20 days. In the Southern York County School District area, the median sold price returned to $389,900, essentially matching June's level, a sign that July's dip was a one month shift in which homes sold rather than a real change in demand.
Why one month of data rarely tells the full story
York County’s housing supply ticked up slightly to 1.7 months in August, still historically tight for this market, while the typical home continued to go under contract in about 20 days, essentially unchanged from July.
The median sold price came in at $322,550, essentially back in line with where it stood in June, after dipping in July. That kind of month to month movement is normal and doesn’t, on its own, signal a shift in either direction. Reading a single month in isolation is exactly how sellers and buyers end up reacting to noise instead of signal.
Southern York County is a clean example of why this matters. July’s numbers there looked concerning taken alone, but paired with August landing back in line with June, they read as ordinary month to month variation rather than a real cooling.
How to read monthly housing data without overreacting
- Look at price, pace, and supply together, not price alone. A single month’s price swing often reflects which specific homes happened to sell, not a change in demand. If days on market and available inventory are holding steady while price moves, that’s usually a sign of which homes transacted that month, not a genuine market shift.
- Compare against recent local history, not a national rule of thumb. Generic industry benchmarks don’t always fit a specific local market. York County’s housing supply has held in a fairly narrow, historically tight range for years, so the most useful comparison is this market against its own recent past, not an abstract national standard.
- Watch two or three months together before drawing a conclusion. One month can be noise. Two or three months moving in the same direction is a pattern. It’s only by comparing August against July’s dip and June’s baseline together that a clearer picture emerges, one where June and August land in nearly the same place, and July stands out as the exception.
- Translate county numbers into what they mean for your street. Countywide and district level data are a starting point, not a final answer. Pricing, pace, and competition can vary block to block, so translating the broader numbers into what they mean for your actual home or neighborhood is where the real decision-making happens.
York County vs. Southern York County School District, August 2026
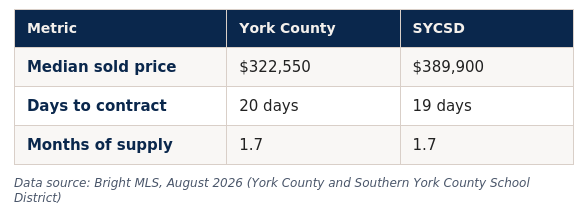
What stands out is how closely the pace and supply numbers converged this month. Both areas landed within a day of each other on days to contract and matched exactly on months of supply, even though price levels remain meaningfully different. The SYCSD figures reflect New Freedom, Shrewsbury, Glen Rock, and Railroad specifically, the district’s actual boundary, rather than the wider Southern York County area.
Frequently asked questions
Conditions still favor sellers. Housing supply sat at 1.7 months in August 2026, well below the level that would signal a shift toward buyers, and homes continued to sell in about 20 days.
The median sold price in York County was $322,550 in August 2026, up about 4 percent from July. In the Southern York County School District area specifically, the median sold price was $389,900.
July’s dip largely reflected which specific homes happened to sell that month rather than a real change in demand. August landing back in line with June, especially in Southern York County, supports that read.
In August 2026, Southern York County School District homes sold for a higher median price than the county overall, while pace and supply were nearly identical between the two areas.
The takeaway
Housing data is most useful when it’s read as a pattern, not a headline. August landing back in line with June is a good reminder that a single month rarely tells the full story, and the real value is in understanding what these numbers mean for your specific plans.
Reach out at 717.817.6371 or jonelle@sychomes.com. I am always happy to talk.